

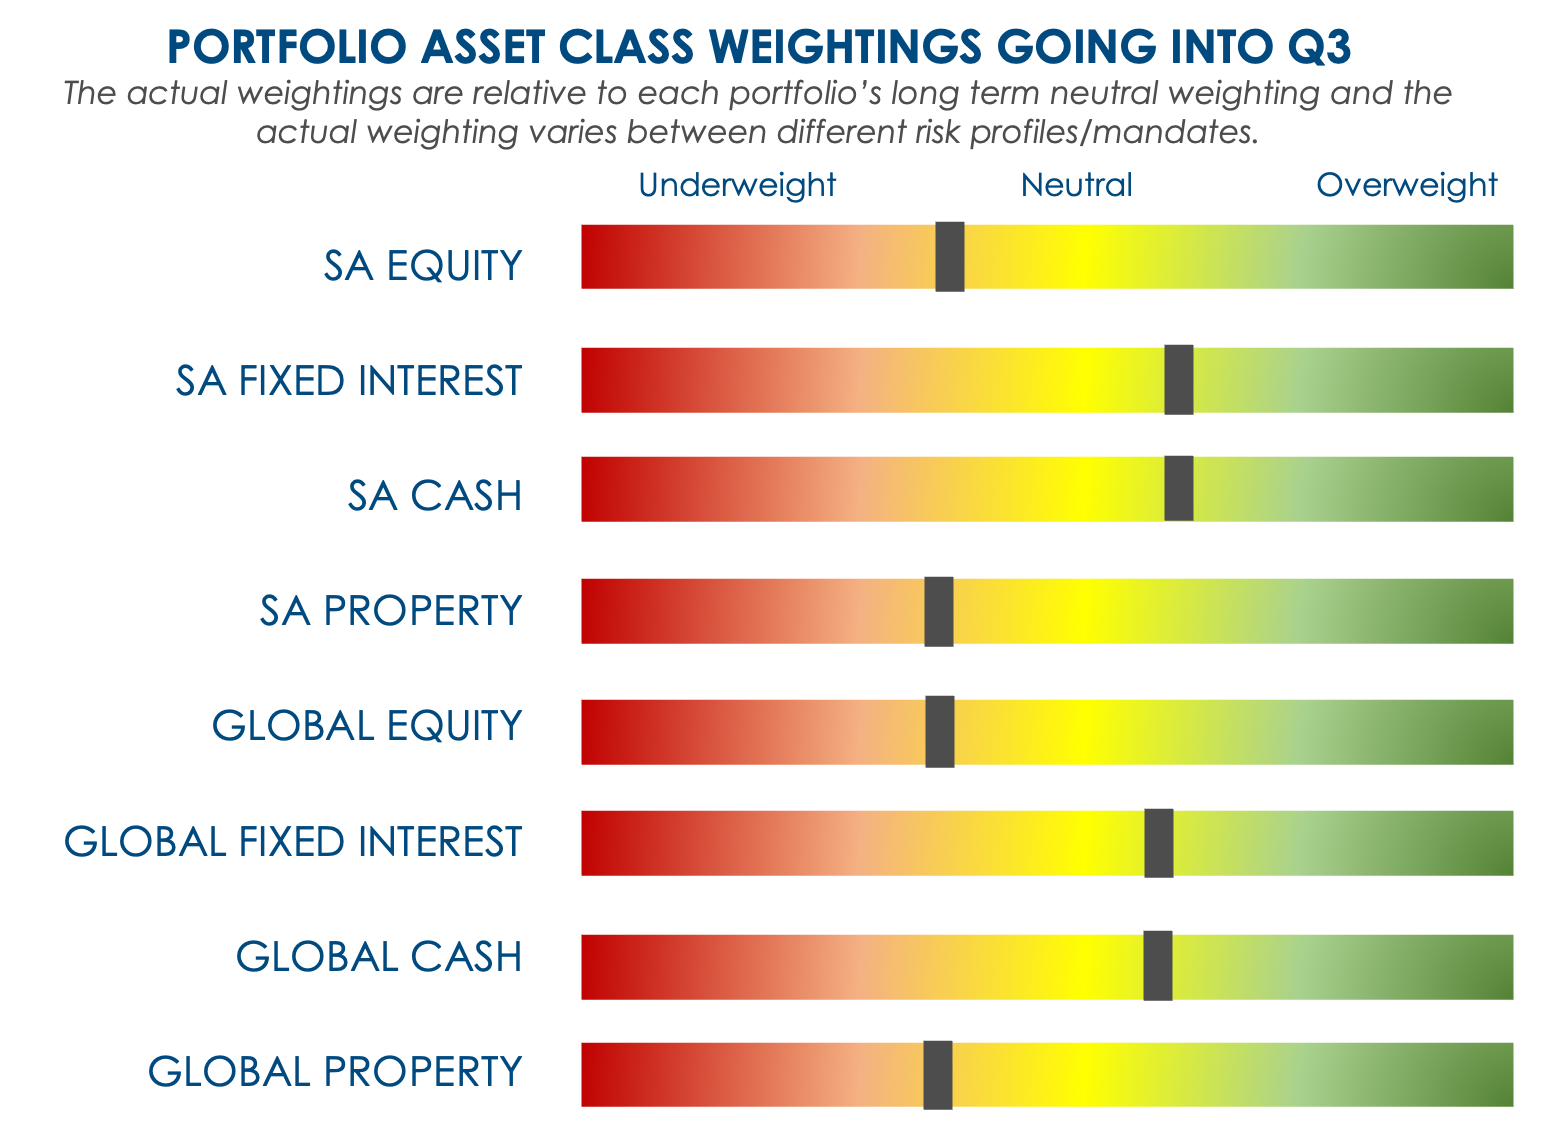
At MitonOptimal we take asset allocation (AA) very seriously, taking into consideration both Strategic AA (3-7 years) and Tactical AA within the various asset classes. This quarterly piece provides insight into our short term tactical calls on a 12-month view (reviewed quarterly) and as such may diverge from our long term strategic AA views. We review our strategic AA bi-annually as we believe this is prudent practice, in a world dominated by debt de-leveraging, central bank and political interference.
|
Index |
Q2 2023 |
Q1 2023 |
| FTSE/JSE Capped SWIX All Share TR ZAR | 0.66 | 2.44 |
| FTSE/JSE SA Listed Property TR ZAR | 0.66 | -5.05 |
| FTSE/JSE All Bond TR ZAR | -1.53 | 3.39 |
| FTSE/JSE ALB 1-3 Yr TR ZAR | 0.48 | 2.40 |
| Allan Gray Money Market | 2.00 | 1.81 |
| MSCI World NR USD | 13.75 | 12.34 |
| MSCI EM NR USD | 7.43 | 8.40 |
| GinsGlobal Global Bond Index | 3.54 | 7.12 |
| OMG Money Market USD | 7.75 | 5.39 |
| S&P Global REIT TR USD | 7.57 | 6.00 |
| Bloomberg Commodity TR USD | 3.75 | -1.31 |
| STeFI Composite ZAR | 1.92 | 1.75 |
| S&P 500 NR USD | 15.64 | 11.95 |
SA EQUITY
UNDERWEIGHT -UNDER PERFORMED
SA Equities continued to underperform in the 2nd quarter of 2023. Although the index (FTSE/JSE All Share) ended the quarter in positive territory (0.66%), the performance was overshadowed by a strong performance from Global Equities and a depreciating ZAR. Although still relatively cheap, even versus other EM counterparts, SA Equities must still contend with a volatile political climate and an economy that is struggling to grow. Not to mention the odd international “misstep” every now and then.
Although inflation seems to have turned the corner globally, interest rates remain high, and it will probably be a while until we see a relaxation from the SARB. With interest rates remaining high and loadshedding continuing to hurt, it’s difficult to see how the economy can get back to a growth rate in excess of population growth. This means the only other factor that could unlock the value in SA Equities would be foreign inflows and we are not seeing that just yet.
Our underweight allocation to SA Equities had a positive relative influence on our portfolios. We remain underweight SA Equities into Q3 of 2023 but could move to neutral if some of the catalysts for EM Equities and foreign investment come through.
SA LISTED PROPERTY
UNDERWEIGHT – UNDERPERFORM
The sector had a troublesome start to the year but gained some momentum in Q2. This saw the sector make up some ground when compared to SA Equities and end the month on a positive return of 0.66%. Although fundamentals for many of the REITs in the sector are looking strong after a horrid 2020, the lack of GDP growth, continuous loadshedding and rising interest rates, are all putting tremendous pressure on the sector.
This caused us to move from neutral to underweight the sector from the start of the year, which benefited our portfolios during this time.
We feel that there is lots of value in the sector, but the pressures pulling down GDP growth and keeping SA Bond yields high is keeping us underweight this sector into Q3.
SA FIXED INTEREST
OVERWEIGHT – UNDER PERFORMED
It was a tough time for SA Bonds this quarter with the FTSE/JSE All Bond Index the only asset class ending the quarter in the red (-1.53%). This was mainly because of longer maturity bonds being negatively affected by interest rate hikes and the sell-off in SA Bonds in general. This contrasts with the FTSE/JSE All Bond 1 – 3 Year Index that returned 0.48% over the same period. We are still seeing value in the medium to short end of the curve with the long end drawing too much risk (in our view) for the benefit in yield pick-up. With many risks on local bonds, especially with the 2024 elections around the corner, we keep our exposure to below the belly of the curve in maturity.
Unfortunately, our overweight on this asset class was a detractor on portfolio performance especially in the wake of a depreciating ZAR when compared to global counterparts. We still hold on to our position, though, and feel that the yield return on offer outweighs the risk of equities and property in the short to medium term.
SA CASH
OVERWEIGHT – OUTPERFORMED
Our overweight exposure to cash was a positive influence on the performance of our funds, relatively speaking.
With the STeFI Composite Index returning 1.92% outperforming both SA Equities and SA Property this quarter. There is still too much risk in the SA economy to move up the risk scale, so we remain cautious and overweight in SA Cash into Q3 2023.
GLOBAL EQUITIES
UNDERWEIGHT – OUTPERFORMED
It was the time of AI and any mention thereof caused stock prices to race upward. Tech stocks dominated, causing the Nasdaq 100 Index (22.78%) to outperform the MSCI World Index (13.75%) by just under 10% for the last 3 months. [All in ZAR terms] These returns completely overshadowed any other asset class for the quarter, even when measured in US Dollar terms. The weakening ZAR contributed 6.47% of returns over the USD return.
After our Investment Committee meeting early in February, we preferred global risk assets to local risk assets and moved the portfolios accordingly. The risks inherent in our local market and pressure on the ZAR had the biggest influence on this decision. Overall, however, we remained underweight risk assets and that continues through the start of Q3 2023.
The MSCI EM Index (7.43% in ZAR terms) outperformed SA Equities but lagged the DM counterparts by some margin. There is clearly something to be said for the spread between valuations in DM vs EM at the moment, but we are still cautious on going overweight EM counters just yet.
GLOBAL PROPERTY
UNDERWEIGHT – OUTPERFORMED
With the ZAR weakening over the quarter, the boost to global property performance pushed it into “outperforming” territory. The S&P Global REIT Index returned 7.57% in ZAR terms, outperforming both local equity and local bonds but underperforming versus the MSCI World.
Our move closer to neutral was a positive contributor, but we are still underweight the asset class moving into Q3. With bond yields looking to cool down, we could see a move to neutral or even overweight in future, but we must see the asset flows first before making the move.
Any sign of interest rate cuts would also be a move in the right direction for global property, but it might be a while until that realizes.
Where we do own global listed property, we are focused on sectors such as warehousing, storage, data centers and infrastructure. Our view is that future interest rate cuts could benefit the sector and we would up our allocation in such an event.
GLOBAL FIXED INTEREST
OVERWEIGHT – OUTPERFORMED
Global Bonds became more intriguing since the start of Q2 with yields for US treasuries edging over 4%. This caused us to move into overweight territory for the first time in a while. The ZAR weakness added to the relative performance of the asset class with the Global Bond Index up 4.85% for the second quarter of the year (in ZAR terms).
With the FED seeming more dovish and bond yields cooling off at the end of the quarter, the overweight allocation might change to neutral. But for now, we are happy with the allocation and picking up the extra yield on offer.
GLOBAL CASH
NEUTRAL – NEUTRAL PERFORMANCE
As with local cash exposure, the Global Cash allocation is used as either a risk mitigator or as a place holder for future deployment into risk opportunities. We moved from underweight to neutral exposure since Q4 2022 and then overweight in Q2 2023. There are still many risks that we fear could play out over the medium term and we are therefore cautious on our risk asset allocation.
We are overweight USD cash / short-dated maturities mainly in our offshore portfolios. We feel confident in maintaining an overweight exposure into Q3, using Global Cash as a risk mitigation tool when and where appropriate.
All data sourced from Morningstar
DOWNLOAD: QUARTERLY MARKET INSIGHTS: Q2 2023

Jacques de Kock
Quantitative Analyst & Portfolio Manager
The content of this article is for information purposes only and does not constitute an offer or invitation to any person. The opinions expressed are subject to change and are not to be interpreted as investment advice. You should consult an adviser who will be able to provide appropriate advice that is based on your specific needs and circumstances. The information and opinions contained herein have been compiled or arrived at from sources believed to be reliable and given in good faith, but no representation is made as to their accuracy, completeness or correctness. MitonOptimal South Africa (Pty) Limited is an Authorised Financial Services Provider Licence No. 28160, regulated by the Financial Sector Conduct Authority (FSCA) – Registration No. 2005/032750/07.MitonOptimal Portfolio Management (Pty) Limited is an Authorised Financial Services Provider Licence No. 734, regulated by the FSCA – Registration No. 2000/000717/07.