

At MitonOptimal we take asset allocation (AA) very seriously, taking into consideration both Strategic AA (3-7 years) and Tactical AA within the various asset classes. This quarterly piece provides insight into our short term tactical calls on a 12-month view (reviewed quarterly) and as such may diverge from our long term strategic AA views. We review our strategic AA bi-annually as we believe this is prudent practice, in a world dominated by debt de-leveraging, central bank and political interference.
|
Index |
Q1-2025 |
Q4-2024 |
|
FTSE/JSE All Share |
5.94 |
-2.13 |
|
FTSE/JSE SA Listed Property |
-3.51 |
-0.83 |
|
FTSE/JSE All Bond |
0.70 |
0.43 |
|
STeFI Composite |
1.89 |
2.01 |
|
MSCI World |
-4.28 |
9.33 |
|
MSCI EM |
0.32 |
0.73 |
|
S&P 500 |
-6.79 |
12.03 |
|
S&P Global REIT |
-0.92 |
-0.12 |
|
GinsGlobal Global Bond Index |
-0.35 |
2.51 |
|
Bloomberg Commodity |
6.12 |
9.01 |
|
USD Money Market |
-1.62 |
10.83 |
Source: Morningstar in ZAR
SA EQUITY
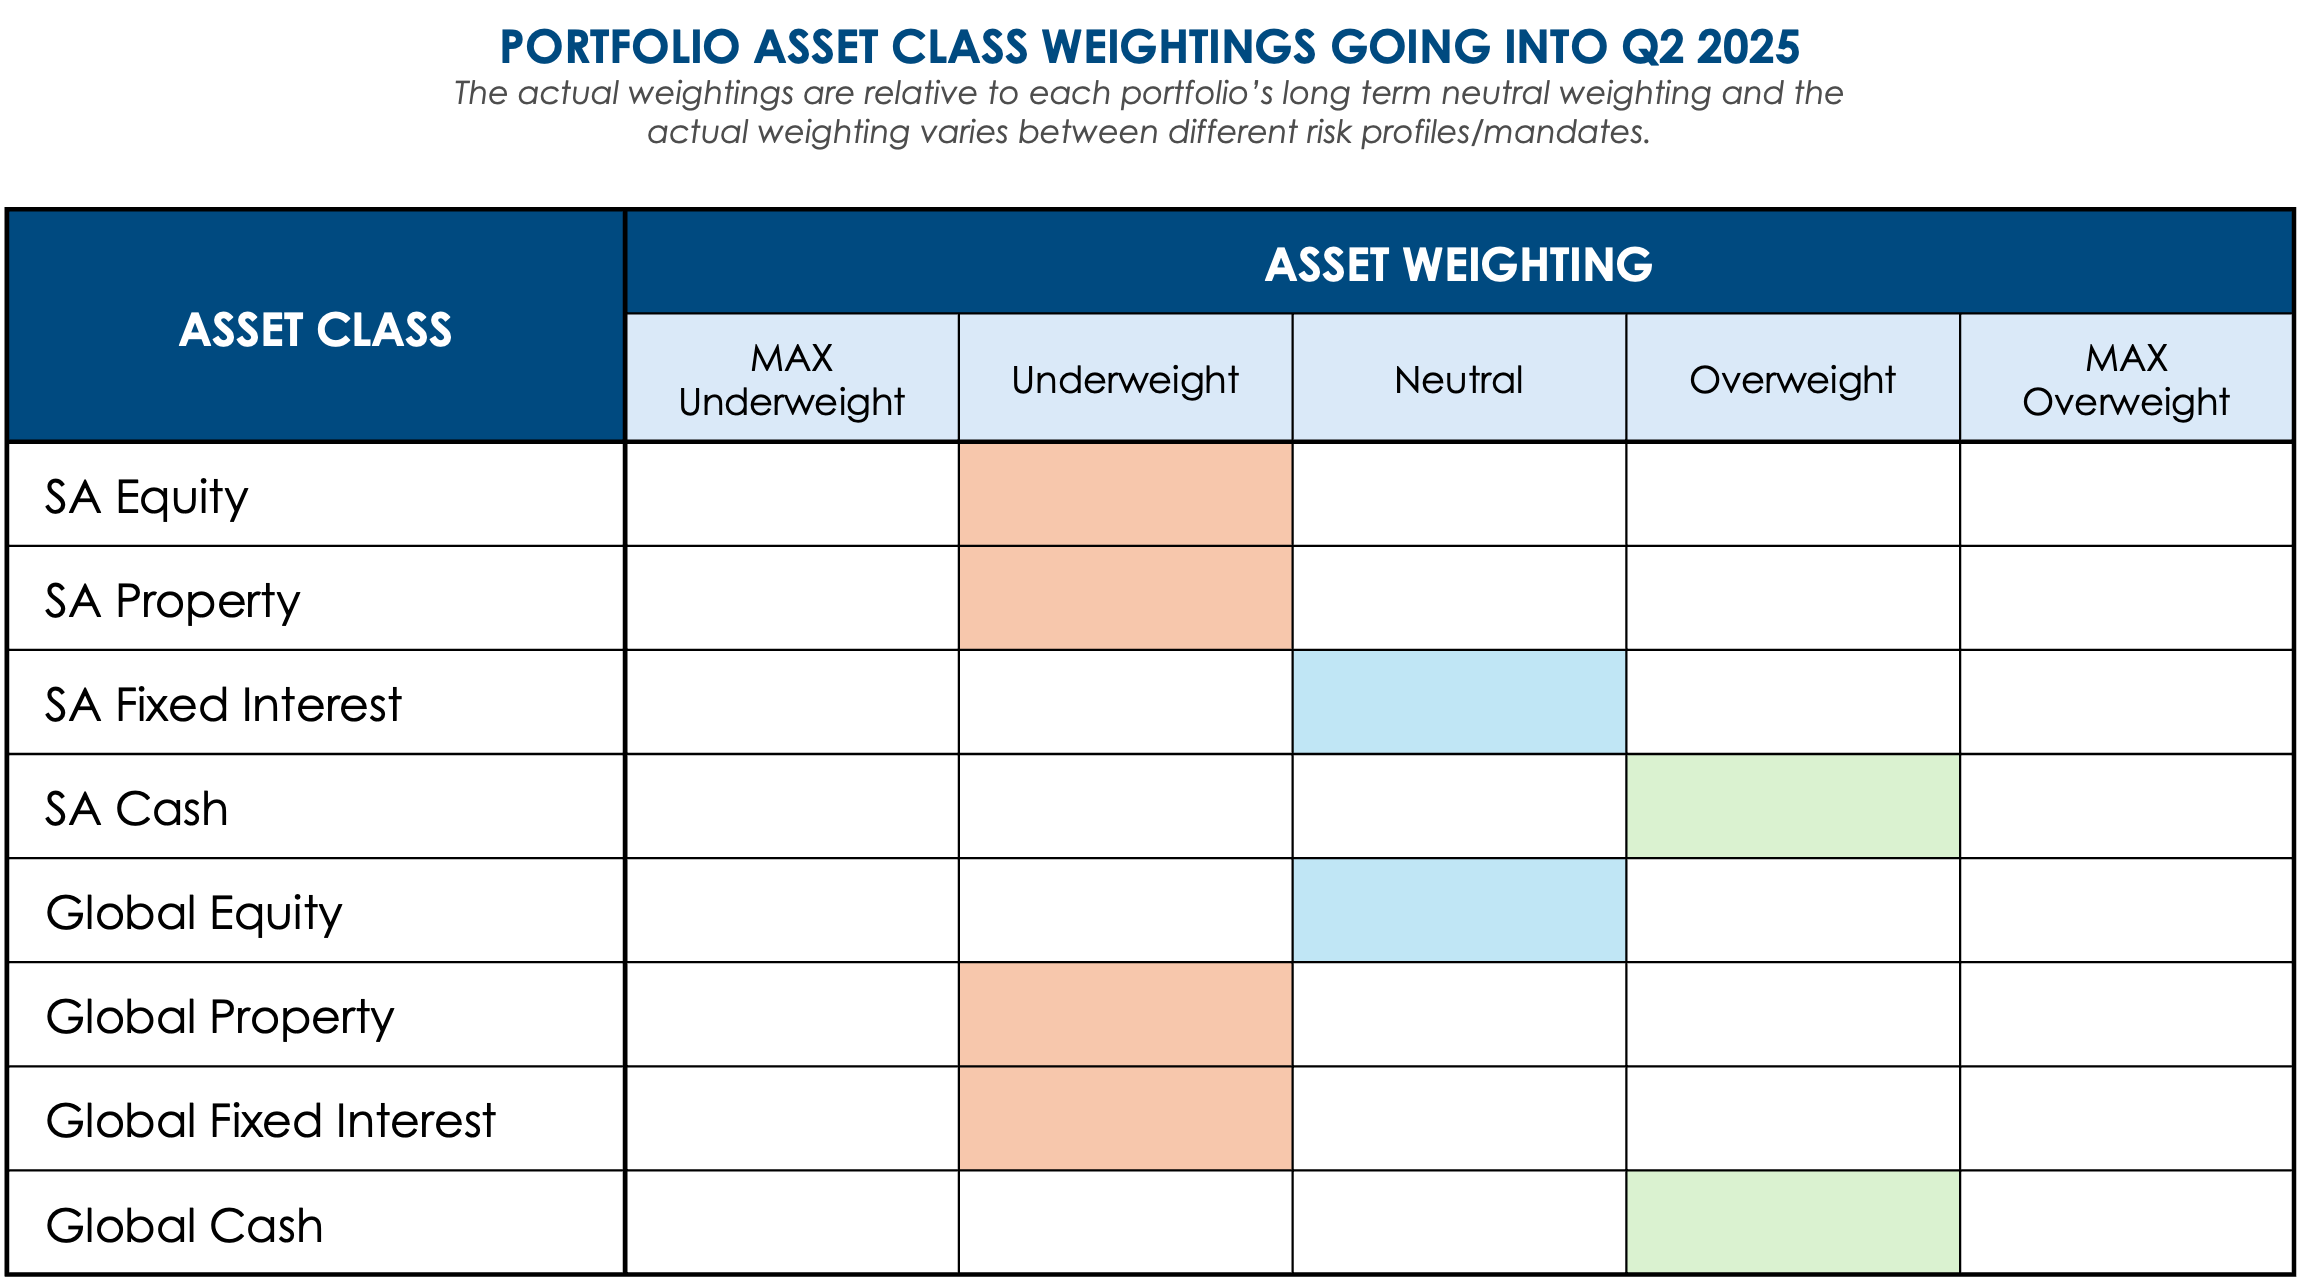
UNDERWEIGHT – OUTPERFORMED
South African equities delivered a strong total return of 5.94% in ZAR and 8.70% in USD during the first quarter of 2025, marking a notable rebound following the muted performance observed in the previous quarter. This performance placed SA equities among the best-performing local asset classes for the period and outpaced returns in most developed and emerging market indices when viewed through a ZAR lens.
A key contributor to this outperformance was the resurgence in the resources sector, underpinned by a global flight to safety and a sharp rise in precious metal prices. Gold and platinum group metals (PGM) counters rallied significantly as the gold price surged past $2,200/oz during March, buoyed by increased geopolitical tensions—particularly in Eastern Europe and the Middle East—and expectations of a shift in US monetary policy. Investors globally sought refuge in hard assets, providing a significant tailwind for South African miners.
Financials and industrials, however, delivered more muted gains. While banks benefitted from the stability in local policy rates and stronger consumer sentiment, retail stocks remained constrained by low real wage growth and persistent unemployment challenges.
Another factor supporting the local equity rally was the strengthening of the South African Rand, which appreciated against the US Dollar during the quarter. Notably, the continued functionality of the Government of National Unity (GNU) provided a degree of policy continuity and improved sentiment among both domestic and offshore investors.
Our underweight positioning in South African equities limited our full participation in this upside. This tactical stance was rooted in caution, given lingering risks including structural fiscal deficits, local- and geo-political risks, electricity supply concerns despite Eskom improvements, and low GDP growth projections (with estimates for 2025 still below 1.5%). Nevertheless, the magnitude and breadth of the Q1 rally were encouraging and reinforce the value of maintaining selective exposure to high-quality domestic counters where earnings momentum remains intact, and valuations are supportive.
SA LISTED PROPERTY
UNDERWEIGHT – UNDERPERFORMED
The FTSE/JSE SA Listed Property Index declined 3.51% over the quarter. The sector struggled under the weight of structural concerns, despite macro improvements elsewhere in the economy. The limited impact of declining inflation and steady rates on capital values was telling, with property counters unable to attract meaningful re-rating.
Although business confidence indicators improved and inflation moved closer to the SARB’s mid-point target, the long-term challenges within the listed property space—particularly around balance sheet health and operational leverage—remain unresolved. Our underweight stance was justified, as capital preservation remained a key consideration in the face of these headwinds.
SA FIXED INTEREST
NEUTRAL – OUTPERFORMED
South African bonds, as tracked by the FTSE/JSE All Bond Index, returned 0.70% for the first quarter of 2025. The local fixed income market benefited from falling inflation and a stable policy environment, while the yield curve saw flattening dynamics amid renewed foreign interest in local sovereign debt. Foreign flows were bolstered by improved domestic sentiment and attractive real yields relative to developed markets.
Concerns around Eskom’s funding model and other state-owned entities remain a fiscal cloud, but Q1 saw a marginal reprieve, with investor focus shifting more to the improving macro stability than the longer-term structural burdens. Our neutral stance allowed portfolios to benefit from modest duration exposure without assuming excessive credit or interest rate risk.
SA CASH
OVERWEIGHT – OUTPERFORMED
The STeFI Composite Index returned 1.89% in ZAR terms. With elevated volatility across equity and property markets and persistent uncertainty around fiscal consolidation, our overweight in SA cash served as an effective buffer and liquidity anchor.
The asset class continued to offer attractive real yields in a declining inflation environment and was used tactically to fund opportunities in risk assets without incurring excessive downside risk. Given its resilience, cash played an important strategic role in enhancing risk-adjusted returns during the quarter.
GLOBAL EQUITIES
NEUTRAL – UNDERPERFORMED
Global equities endured a challenging start to the year, with the MSCI ACWI Index declining by -3.82% in USD terms during Q1 2025. This broadly negative performance reflected rising investor caution amid heightened geopolitical risk, lackluster economic data from several major economies, and an increasingly uncertain policy backdrop. The selloff was both geographically and sectorally widespread, with a particularly sharp pullback in large-cap technology names that had led the 2024 rally.
In the United States, the S&P 500 fell -4.37% in USD terms, reversing some of its strong late-2024 gains. Much of the weakness occurred in March, triggered by mounting concerns over slowing corporate earnings growth, disappointing macroeconomic releases, and an uptick in jobless claims. While inflation continued to trend lower, the Federal Reserve’s mixed signals on the path of interest rates created market confusion.
The technology sector, which had become increasingly crowded, experienced a notable correction. Companies like Nvidia, Alphabet, and Meta saw double-digit drawdowns in February and March as stretched valuations came under pressure amid rising bond yields and weaker guidance for Q2. Financials and consumer discretionary stocks also underperformed, driven by macro headwinds and tightening credit conditions.
In Europe, equities were similarly affected by weak economic momentum. The Eurozone narrowly avoided a technical recession, but Germany (the bloc’s largest economy) remained in contraction. United Kingdom equities posted marginally better relative performance, supported by strength in energy and financial sectors.
Emerging markets, however, provided a relative bright spot. The MSCI EM Index rose by 0.32% in USD terms, outperforming developed peers. This divergence was underpinned by renewed stimulus from China, where the government unveiled a RMB 1 trillion infrastructure spending package and cut the medium-term lending facility rate by 25bps. Chinese equities rebounded in March, though property sector woes continued to limit broader market enthusiasm. India maintained its upward trajectory, buoyed by strong domestic demand, falling inflation, and supportive fiscal measures ahead of the national election. Brazil and Mexico also recorded modest gains as their central banks began monetary easing cycles earlier than developed peers.
Our neutral allocation to global equities reflected a balanced view entering the quarter acknowledging the tailwinds of a potential pivot in global monetary policy while remaining wary of elevated valuations and geopolitical risks. That being said, we upweighted emerging market equities (albeit only slightly) versus developed market equities which stood us in good stead over the quarter. Currency effects, particularly Rand strength in Q1, further reduced the translated returns for South African investors. While our position limited exposure to deeper losses, the prevailing volatility affirmed our cautious and diversified approach.
GLOBAL PROPERTY
UNDERWEIGHT – NEUTRAL PERFORMANCE
The S&P Global REIT Index declined 0.92% in USD, aided by a softening USD and moderate strength in select subsectors such as logistics and data infrastructure. However, persistent weakness in retail and office REITs—particularly in the US and parts of Europe—kept the sector’s upside in check.
Our underweight positioning in global property reflected both valuation concerns and an expectation of structural headwinds in traditional segments of the market. While there may be pockets of opportunity, we remain cautious in deploying capital broadly into this asset class without confirmation of a sustainable recovery in fundamentals.
GLOBAL FIXED INTEREST
NEUTRAL – NEUTRAL PERFORMANCE
The GinsGlobal Global Bond Index delivered a small loss of 0.35% in USD as the quarter was characterized by mixed central bank signals. While the Fed held its policy rate steady, it reiterated a data-dependent stance, and markets continued to price in potential cuts for the second half of the year. Meanwhile, the ECB and BoE echoed dovish tones amid softer inflation prints across the Eurozone and UK.
Despite this, long-duration bonds remained volatile due to rising concerns over fiscal deficits and the resilience of wage-driven inflation in the US. Our neutral allocation allowed portfolios to retain interest rate sensitivity without assuming excess risk, particularly in a still-evolving global macro environment.
GLOBAL CASH
OVERWEIGHT – NEUTRAL PERFORMANCE
Global cash, as represented by the OMG Money Market USD Fund, returned -1.62% in USD but eked out a 0.94% gain in ZAR. While nominal USD yields remained elevated, the strengthening Rand eroded some of the local currency gains typically derived from this defensive asset class.
Our overweight positioning in global cash provided both liquidity and downside protection amid heightened global risk-off sentiment. While underwhelming in absolute return terms, the asset class continued to serve a critical role in managing volatility, funding tactical re-entries into risk assets, and supporting a barbell portfolio construction.
- Overweight / Neutral / Underweight indicates the MitonOptimal asset allocation views
- Outperformed / Neutral / Underperformed indicates the asset class performance over the quarter
Source of all data: Morningstar. Unless otherwise stated all local data is in ZAR and all offshore data is in USD.
DOWNLOAD: QUARTERLY MARKET INSIGHTS: Q1 2025

Jacques de Kock
Quantitative Analyst & Portfolio Manager
The content of this article is for information purposes only and does not constitute an offer or invitation to any person. The opinions expressed are subject to change and are not to be interpreted as investment advice. You should consult an adviser who will be able to provide appropriate advice that is based on your specific needs and circumstances. The information and opinions contained herein have been compiled or arrived at from sources believed to be reliable and given in good faith, but no representation is made as to their accuracy, completeness or correctness. MitonOptimal South Africa (Pty) Limited is an Authorised Financial Services Provider Licence No. 28160, regulated by the Financial Sector Conduct Authority (FSCA) – Registration No. 2005/032750/07.MitonOptimal Portfolio Management (Pty) Limited is an Authorised Financial Services Provider Licence No. 734, regulated by the FSCA – Registration No. 2000/000717/07.